Search for Indicators

Priority: Lifestyle & Wellness

UNC Lenoir Health Care aims to improve the lifestyles of the community.

Indicator Gauge Icon Legend

Legend Colors

Red is bad, green is good, blue is not statistically different/neutral.

Compared to Distribution

an indicator guage with the arrow in the green the value is in the best half of communities.

an indicator guage with the arrow in the yellow 
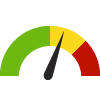
the value is in the 2nd worst quarter of communities.

an indicator guage with the arrow in the red the value is in the worst quarter of communities.

Compared to Target

green circle with white tick inside it meets target; red circle with white cross inside it does not meet target.

Compared to a Single Value

green diamond with downward arrow inside it lower than the comparison value; red diamond with downward arrow inside it higher than the comparison value; blue diamond with downward arrow inside it not statistically different from comparison value.

Trend

green square outline with upward trending arrow inside it green square outline with downward trending arrow inside it non-significant change over time; green square with upward trending arrow inside it green square with downward trending arrow inside it significant change over time; blue square with equals sign no change over time.

Compared to Prior Value

green triangle with upward trending arrow inside it higher than the previous measurement period; green triangle with downward trending arrow inside it lower than the previous measurement period; blue equals sign no statistically different change  from previous measurement period.

green chart bars Significantly better than the overall value

red chart bars Significantly worse than the overall value

dark blue chart bars Significantly different than the overall value

light blue chart bars No significant difference with the overall value

gray chart bars No data on significance available

More information about the gauges and icons

Self-Reported General Health Assessment: Poor or Fair County: Lenoir

Current Value:

Self-Reported General Health Assessment: Poor or Fair County: Lenoir

24.1%
(2021)
Compared to:
Compared to NC Counties, Lenoir has a value of 24.1% which is in the worst 25% of counties. Counties in the best 50% have a value lower than 18.1% while counties in the worst 25% have a value higher than 21.4%.
NC Counties
The distribution is based on data from 100 North Carolina counties.
Compared to U.S. Counties, Lenoir has a value of 24.1% which is in the worst 25% of counties. Counties in the best 50% have a value lower than 18.5% while counties in the worst 25% have a value higher than 22.5%.
U.S. Counties
The distribution is based on data from 3,074 U.S. counties and county equivalents.
Compared to the US Value (16.1%), Lenoir has a value of 24.1% which is higher and worse.
US Value
(16.1%)
The regional value is compared to the national value.

Poor Physical Health: Average Number of Days County: Lenoir

Current Value:

Poor Physical Health: Average Number of Days County: Lenoir

4.3
Days
(2021)
Compared to:
Compared to NC Counties, Lenoir has a value of 4.3 which is in the worst 25% of counties. Counties in the best 50% have a value lower than 3.7 while counties in the worst 25% have a value higher than 3.9.
NC Counties
The distribution is based on data from 100 North Carolina counties.
Compared to U.S. Counties, Lenoir has a value of 4.3 which is in the worst 25% of counties. Counties in the best 50% have a value lower than 3.9 while counties in the worst 25% have a value higher than 4.3.
U.S. Counties
The distribution is based on data from 3,141 U.S. counties and county equivalents.
Compared to the NC Value (3.3), Lenoir has a value of 4.3 which is higher and worse.
NC Value
(3.3)
The regional value is compared to the North Carolina State value.
Compared to the US Value (3.3), Lenoir has a value of 4.3 which is higher and worse.
US Value
(3.3)
The regional value is compared to the national value.
Compared to the prior value, Lenoir (4.3) is not statistically different from the previously measured value (3.7).
Prior Value
(3.7)
Prior Value compares a measured value with the previously measured value. Confidence intervals were taken into account in determining the direction of the comparison.
Over time, the Lenoir value is decreasing, not significantly.
Trend
This comparison measures the indicator’s values over multiple time periods.<br>The Mann-Kendall Test for Statistical Significance is used to evaluate the trend<br>over 4 to 10 periods of measure, subject to data availability and comparability.

Poor Physical Health: 14+ Days

Value
Compared to:

Poor Physical Health: 14+ Days

Value
Compared to:

Poor Physical Health: 14+ Days County: Lenoir

Current Value:

Poor Physical Health: 14+ Days County: Lenoir

15.7%
(2021)
Compared to:
Compared to NC Counties, Lenoir has a value of 15.7% which is in the worst 25% of counties. Counties in the best 50% have a value lower than 13.2% while counties in the worst 25% have a value higher than 14.4%.
NC Counties
The distribution is based on data from 100 North Carolina counties.
Compared to U.S. Counties, Lenoir has a value of 15.7% which is in the worst 25% of counties. Counties in the best 50% have a value lower than 13.0% while counties in the worst 25% have a value higher than 14.7%.
U.S. Counties
The distribution is based on data from 3,074 U.S. counties and county equivalents.
Compared to the US Value (10.9%), Lenoir has a value of 15.7% which is higher and worse.
US Value
(10.9%)
The regional value is compared to the national value.

Life Expectancy

Value
Compared to:

Life Expectancy

Value
Compared to:

Life Expectancy County: Lenoir

Current Value:

Life Expectancy County: Lenoir

71.7
Years
(2019-2021)
Compared to:
Compared to NC Counties, Lenoir has a value of 71.7 which is in the worst 25% of counties. Counties in the best 50%  have a value higher than 75.1 while counties in the worst 25% have a value lower than 73.8.
NC Counties
The distribution is based on data from 100 North Carolina counties.
Compared to U.S. Counties, Lenoir has a value of 71.7 which is in the worst 25% of counties. Counties in the best 50%  have a value higher than 75.8 while counties in the worst 25% have a value lower than 73.6.
U.S. Counties
The distribution is based on data from 3,070 U.S. counties and county equivalents.
Compared to the NC Value (76.6), Lenoir has a value of 71.7 which is lower and worse.
NC Value
(76.6)
The regional value is compared to the North Carolina State value.
Compared to the US Value (77.6), Lenoir has a value of 71.7 which is lower and worse.
US Value
(77.6)
The regional value is compared to the national value.
Compared to the Healthy NC 2030 Target (82), the target has not been met.
Healthy NC 2030 Target
(82)
  • Download JPEG
  • Download PDF
  • Download CSV

Insufficient Sleep

Value
Compared to:

Insufficient Sleep

Value
Compared to:

Insufficient Sleep County: Lenoir

Current Value:

Insufficient Sleep County: Lenoir

38.5%
(2020)
Compared to:
Compared to NC Counties, Lenoir has a value of 38.5% which is in the worst 25% of counties. Counties in the best 50% have a value lower than 34.0% while counties in the worst 25% have a value higher than 36.4%.
NC Counties
The distribution is based on data from 100 North Carolina counties.
Compared to U.S. Counties, Lenoir has a value of 38.5% which is in the worst 25% of counties. Counties in the best 50% have a value lower than 34.5% while counties in the worst 25% have a value higher than 36.8%.
U.S. Counties
The distribution is based on data from 3,140 U.S. counties and county equivalents.
Compared to the NC Value (31.8%), Lenoir has a value of 38.5% which is higher and worse.
NC Value
(31.8%)
The regional value is compared to the North Carolina State value.
Compared to the US Value (33.0%), Lenoir has a value of 38.5% which is higher and worse.
US Value
(33.0%)
The regional value is compared to the national value.
Compared to the prior value, Lenoir (38.5%) is less and better than the previously measured value (40.5%).
Prior Value
(40.5%)
Prior Value compares a measured value with the previously measured value. Confidence intervals were not taken into account in determining the direction of the comparison.
Compared to the HP 2030 Target (26.7%), the target has not been met.
HP 2030 Target
(26.7%)

Frequent Physical Distress

Value
Compared to:

Frequent Physical Distress

Value
Compared to:

Frequent Physical Distress County: Lenoir

Current Value:

Frequent Physical Distress County: Lenoir

15.6%
(2019)
Compared to:
Compared to NC Counties, Lenoir has a value of 15.6% which is in the worst 25% of counties. Counties in the best 50% have a value lower than 13.5% while counties in the worst 25% have a value higher than 15.0%.
NC Counties
The distribution is based on data from 100 North Carolina counties.
Compared to U.S. Counties, Lenoir has a value of 15.6% which is in the worst 25% of counties. Counties in the best 50% have a value lower than 13.6% while counties in the worst 25% have a value higher than 15.5%.
U.S. Counties
The distribution is based on data from 3,121 U.S. counties and county equivalents.
Compared to the NC Value (12.0%), Lenoir has a value of 15.6% which is higher and worse.
NC Value
(12.0%)
The regional value is compared to the North Carolina State value.
Compared to the US Value (12.0%), Lenoir has a value of 15.6% which is higher and worse.
US Value
(12.0%)
The regional value is compared to the national value.
Compared to the prior value, Lenoir (15.6%) is not statistically different from the previously measured value (15.7%).
Prior Value
(15.7%)
Prior Value compares a measured value with the previously measured value. Confidence intervals were taken into account in determining the direction of the comparison.